
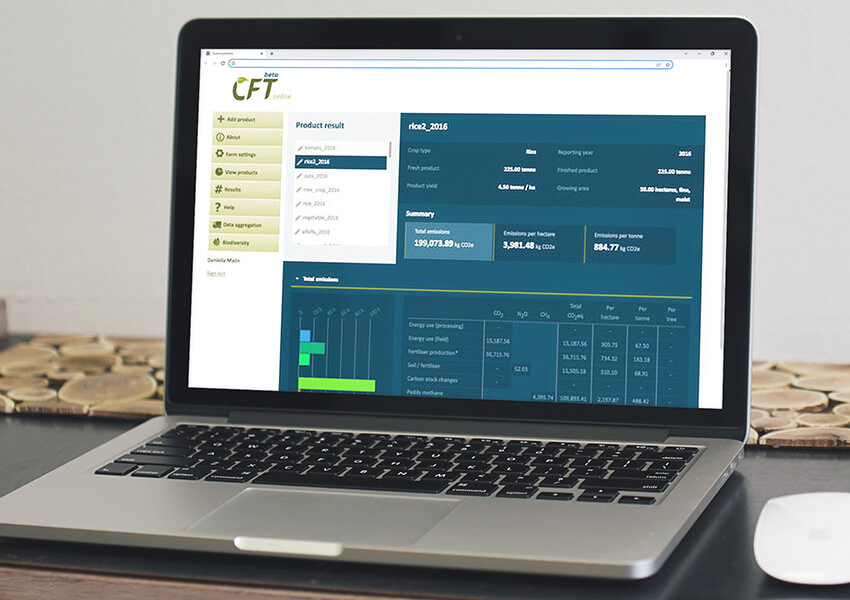
Harvested yield and marketable yield product weights

Growing area

Fertiliser
applications: type and rate

Rate and active ingredient of crop protection

Energy use
(kWh and fuel use)
Optionally: transport: mode, weight and distance

Herd or
flock size

Feed

Manure management
Energy use
(kWh and fuel use)
Transport of
feed and
other inputs
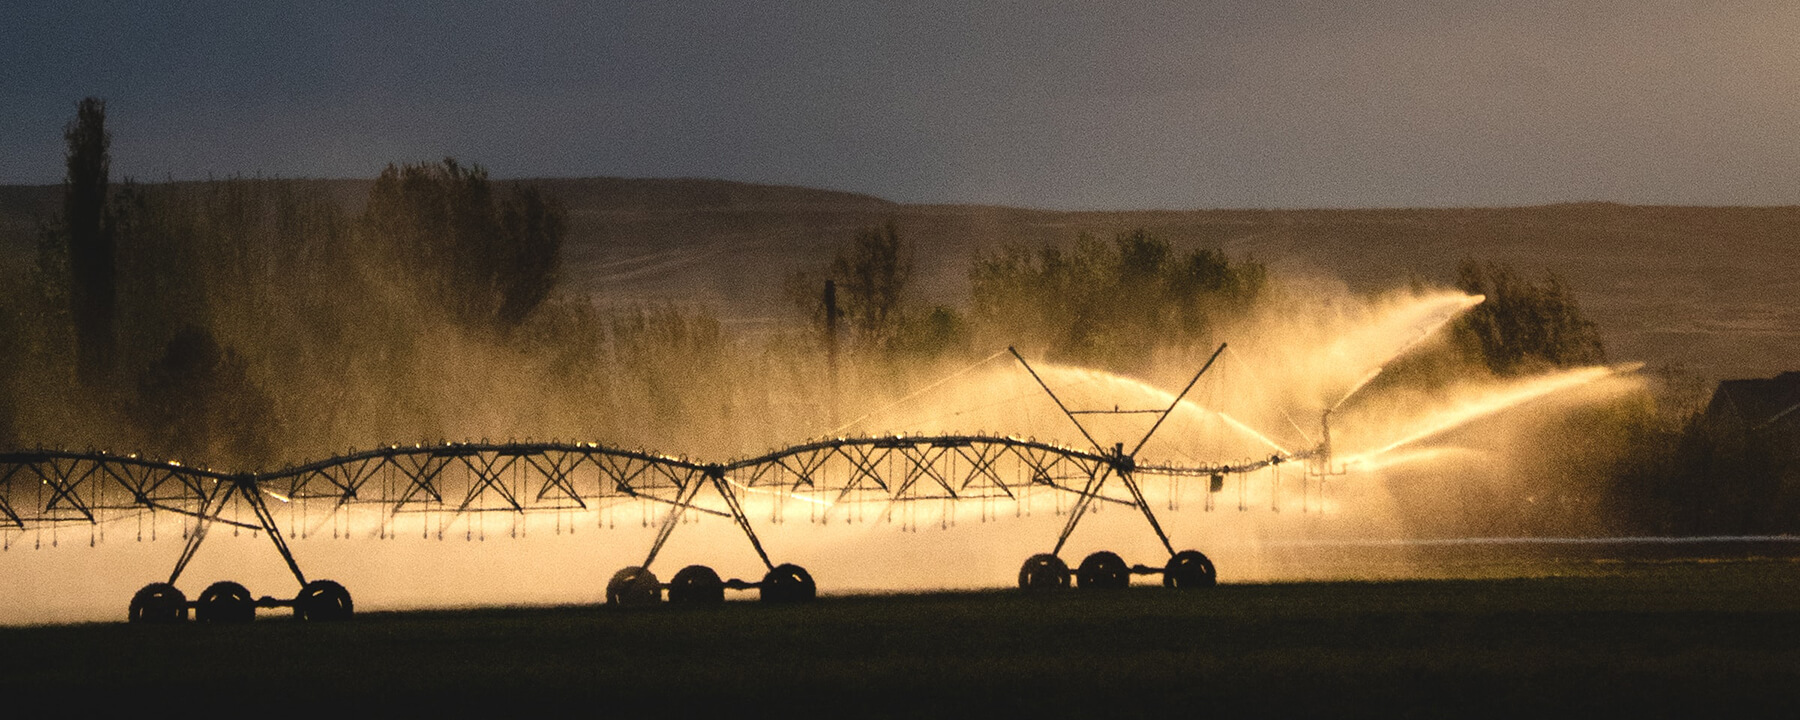

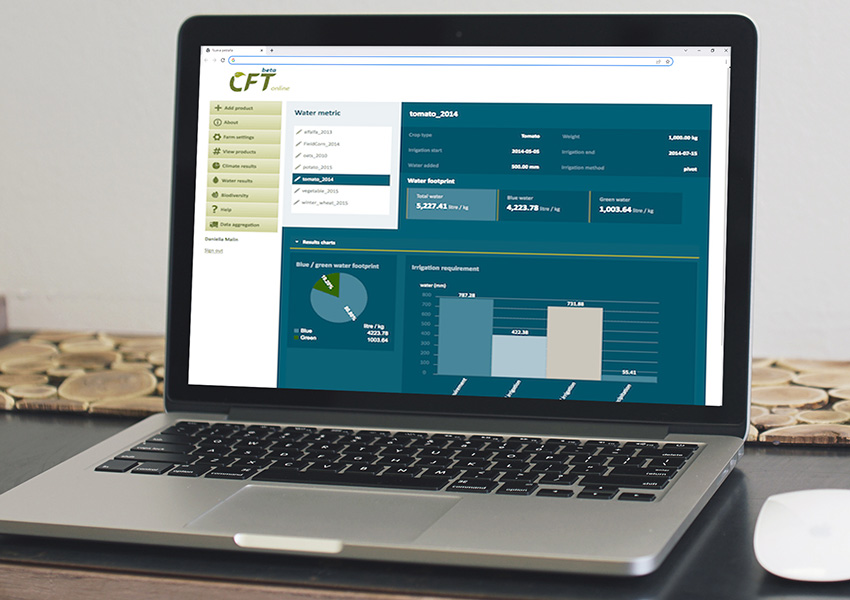
Click on the map or manually record latitude and longitude in your farm settings

Indicate planting/ harvesting timeframes and soil moisture at planting (dry, medium, wet)

Enter your water amounts applied to compare it with crop irrigation needs

Keep track how irrigation events are spread throughout growing season
The total area
of the farm, including
non-productive land

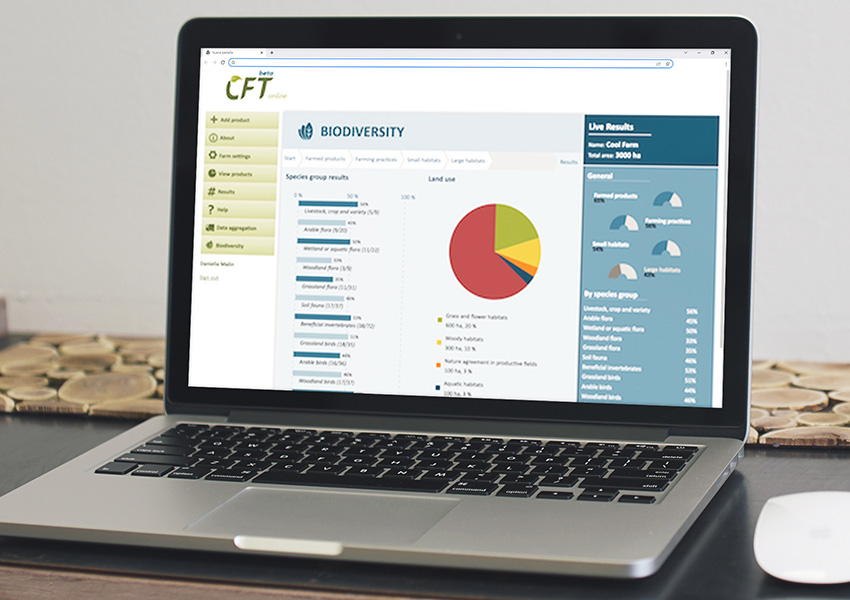
General information
about farm management practices, inputs and cultivation

Provision of small
habitats less than a hectare

Provision of large habitats for nature conservation greater than one hectare